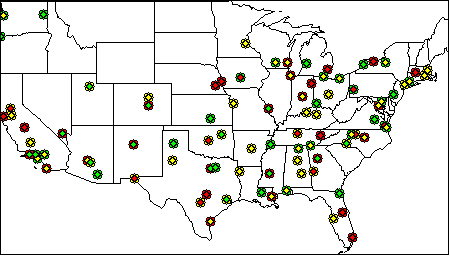

DecisionMaps™ can both summarize and reveal details in one view.
For example, DecisionMaps can provide far more information on one page than can a consolidated financial statement.
The consolidated financial statement reduces the financial information to one-page, but loses all local level details.
Using a one-page DecisionMap, it is possible to symbolically represent three or four key financial variables, plus varibles representing the market and competition, for hundreds of company locations. So, you can see which locations are helping, and which are hurting, performance and understand WHY! The U.S. map above represents two variables for 100 locations.
When running on your computer, a click of the computer mouse can drop you down for a closer look at any region or location you select. How the variables are displayed and what they symbolize can change with each perspective (zoom in or zoom out) to appropriately represent that perspective.
To turn your financial reporting system into a strategic management system now just email the best time and way for us to contact you to discuss it privately and confidentially.
Copyright © 2000; revised 2017 GAPuzey Consultants. All rights reserved.
DecisionMaps and DecisionMap are service marks of GAPuzey Consultants.
Performance overview for 100 locations
(using a simple two variable model).
